A global map of Local Climate Zones

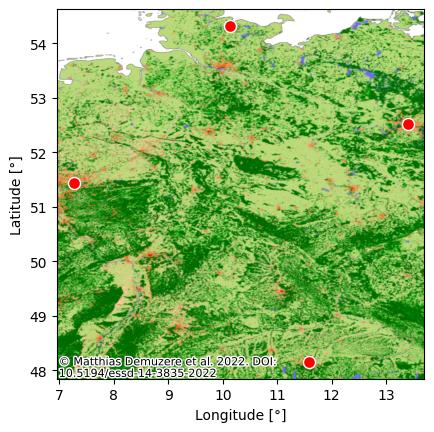
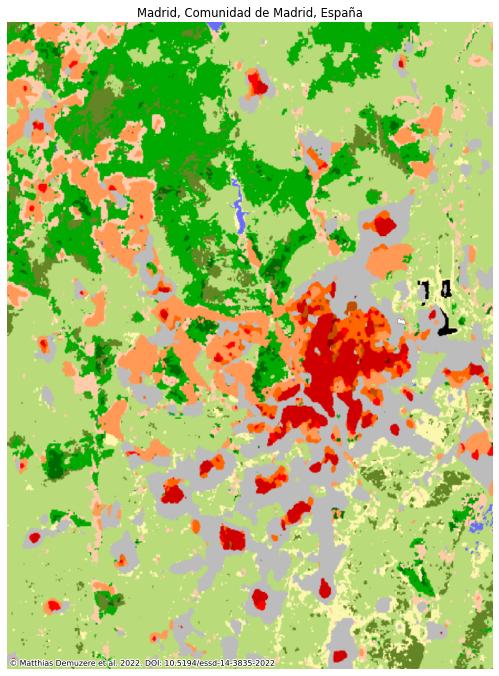
This interface allows you to interactively explore the 100 m spatial resolution global map of Local Climate Zones (LCZ), that is derived from multiple earth observation datasets and expert LCZ class labels. The LCZ typology (Stewart and Oke, 2012) is a universal urban typology that can distinguish urban areas on a holistic basis, accounting for the typical combination of micro-scale land-covers and associated physical properties. The LCZ scheme is distinguished from other land use / land cover schemes by its focus on urban and rural landscape types, which can be described by any of the 17 classes in the LCZ scheme. Its strong added value is thus the diversity of urban classes, which are easily interpretable and globally consistent, capturing the intra-urban variability of surface forms and land functions.

Publication: DOI Publication

Demuzere, M., Kittner, J., Martilli, A., Mills, G., Moede, C., Stewart, I. D., van Vliet, J., and Bechtel, B. (2022): A global map of local climate zones to support earth system modelling and urban-scale environmental science, Earth Syst. Sci. Data, 14, 3835-3873, https://doi.org/10.5194/essd-14-3835-2022.

Dataset & Download: DOI Dataset

Demuzere, M., Kittner, J., Martilli, A., Mills, G., Moede, C., Stewart, I. D., van Vliet, J., and Bechtel, B. (2022): Global map of Local Climate Zones. Zenodo. https://doi.org/10.5281/zenodo.6364593.

Google Earth Engine: DOI Dataset

The dataset is also available in the Google Earth Engine Data Catalog and the ImageCollection can be accessed via:

ee.ImageCollection("RUB/RUBCLIM/LCZ/global_lcz_map/latest")

Local Climate Zones

Built types
1 - Compact highrise
2 - Compact midrise
3 - Compact lowrise
4 - Open highrise
5 - Open midrise
6 - Open lowrise
7 - Lightweight lowrise
8 - Large lowrise
9 - Sparsely built
10 - Heavy industry
Land cover types
A - Dense trees
B - Scattered trees
C - Bush, scrub
D - Low plants
E - Bare rock or paved
F - Bare soil or sand
G - Water

Using the Tile Map Service

The global LCZ Map is also available as a Tile Map Service, which can be used for various applications (GIS, Python, R. etc. ...) in your own project.

Currently there are two versions of the global LCZ Map available you can choose from:

Latest Version
Version 3
Version 2

Background Map with Python and contextily

Add background to geopandas plot

You can use contextily to add the LCZ map to a geopandas plot.

  1. Install the necessary Python packages
  2. pip install -U geopandas contextily
  3. Setup a Provider instance
  4. import contextily as cx
    import geopandas as gpd
    from xyzservices import TileProvider
    
    
    lcz_map = TileProvider(
        url='https://lcz-generator.rub.de/tms-inverted/global-map-tiles/latest/{z}/{x}/{y}.png',
        html_attribution='&copy; <a href="https://doi.org/10.5194/essd-14-3835-2022">Matthias Demuzere et al. 2022</a>',
        attribution='© Matthias Demuzere et al. 2022. DOI: 10.5194/essd-14-3835-2022',
        min_zoom=2,
        max_zoom=13,
        name='Global LCZ Map',
        crs='EPSG:4326',
    )
  5. Create plots using geopandas and contextily as a background map
  6. # any geopandas GeoDataFrame
    gdf = gpd.GeoDataFrame(
        ['Bochum', 'Berlin', 'Munich', 'Kiel'],
        geometry=gpd.points_from_xy(
            x=[7.2618, 13.3911, 11.5796, 10.1285],
            y=[51.4438, 52.5169, 48.1535, 54.3210],
            crs='EPSG:4326',
        ),
    )
    # plot the dataframe
    ax = gdf.plot(color='red', markersize=75, edgecolor='white')
    # add the global LCZ map as a basemap
    cx.add_basemap(ax, crs='EPSG:4326', source=lcz_map)
    ax.set_ylabel('Latitude [°]')
    ax.set_xlabel('Longitude [°]')
    
    ...

Plot a specific place

madrid = cx.Place('Madrid', source=lcz_map, zoom=11)
ax = madrid.plot()

QGIS with XYZ Tiles

  1. Copy the URL template
  2. https://lcz-generator.rub.de/tms/global-map-tiles/latest/{z}/{x}/{-y}.png
  3. In QGIS, add a new XYZ Tiles connection. In the Browser on the left side, right click XYZ Tiles and select New Connection...
  4. Fill out the form
    • Set a Name for the Layer e.g. Global LCZ Map
    • Paste the URL (copy from above) in the URL field
    • Set Min. Zoom Level to 2
    • Set Max. Zoom Level to 13
  5. Drag the Global LCZ Map Layer into the Layers window